

Modelle
Simulation of Saturation with 3-Wire CM-Chokes
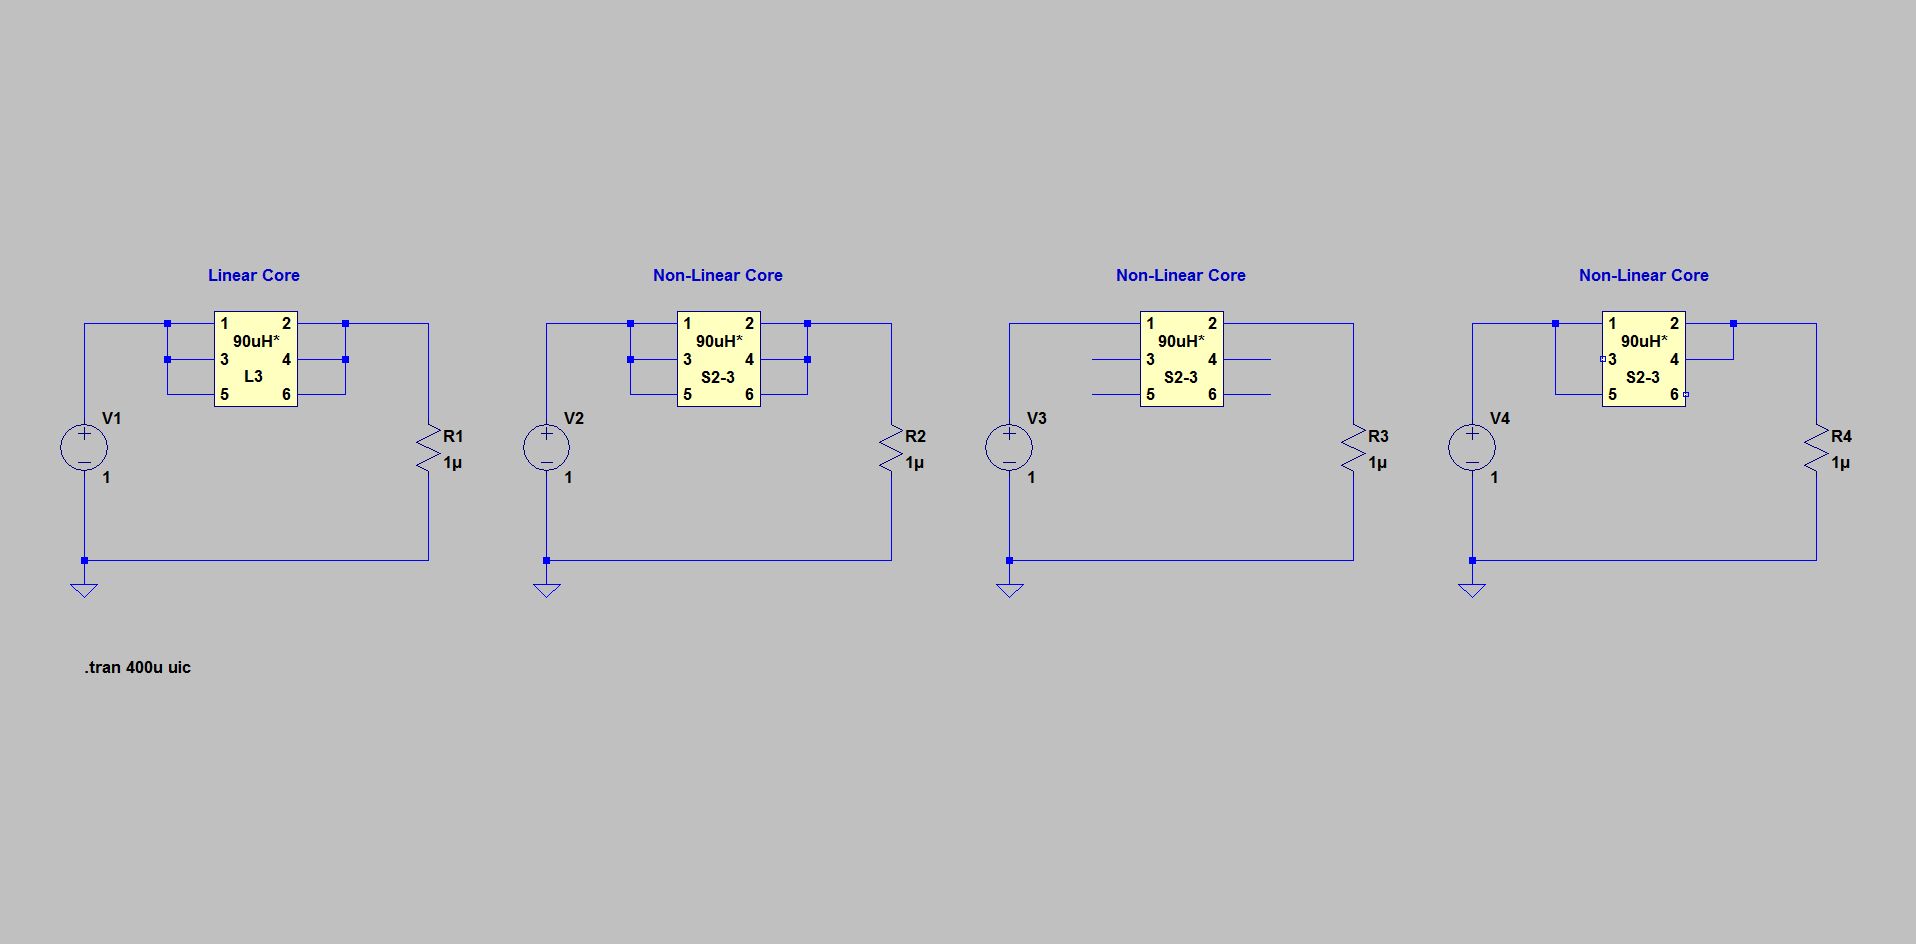
In this simulation, 3-Wire Common-Mode-Chokes (CM) are shown - the left model has a purely linear behavior, while the other models simulate the saturation behavior of a nanocrystalline material. Despite the different circuits, the CM-Chokes always have the same behavior, regardless if all lines are connected in parallel - or only two - or only one.
The linear and the non-linear choke also have the same frequency response, which was also modeled on a nanocrystalline material.
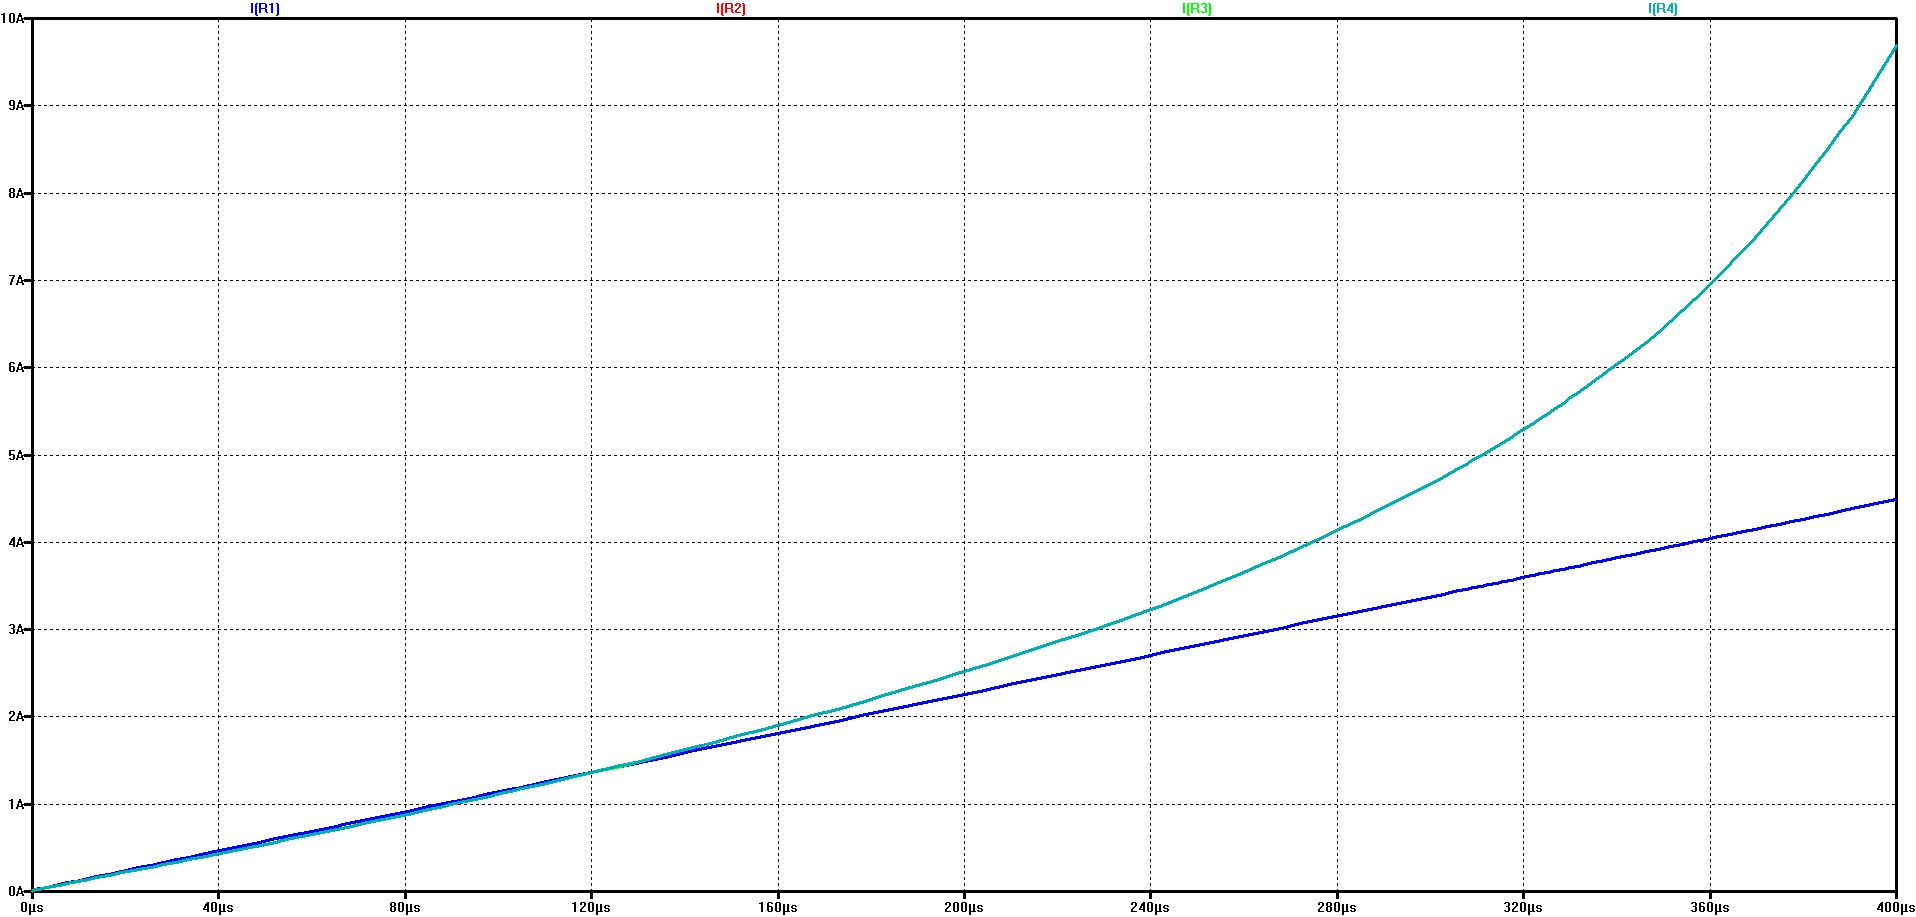
The diagram shows the current change over time - blue the Linear CM-Core - turquoise the Non-Linear CM-Core
All non-linear simulations show the same curve and lie one above the other - with the turquoise curve on top
Defining the start of saturation at 10% deviation from the linear behavior, the saturation current here is
just over 2 A
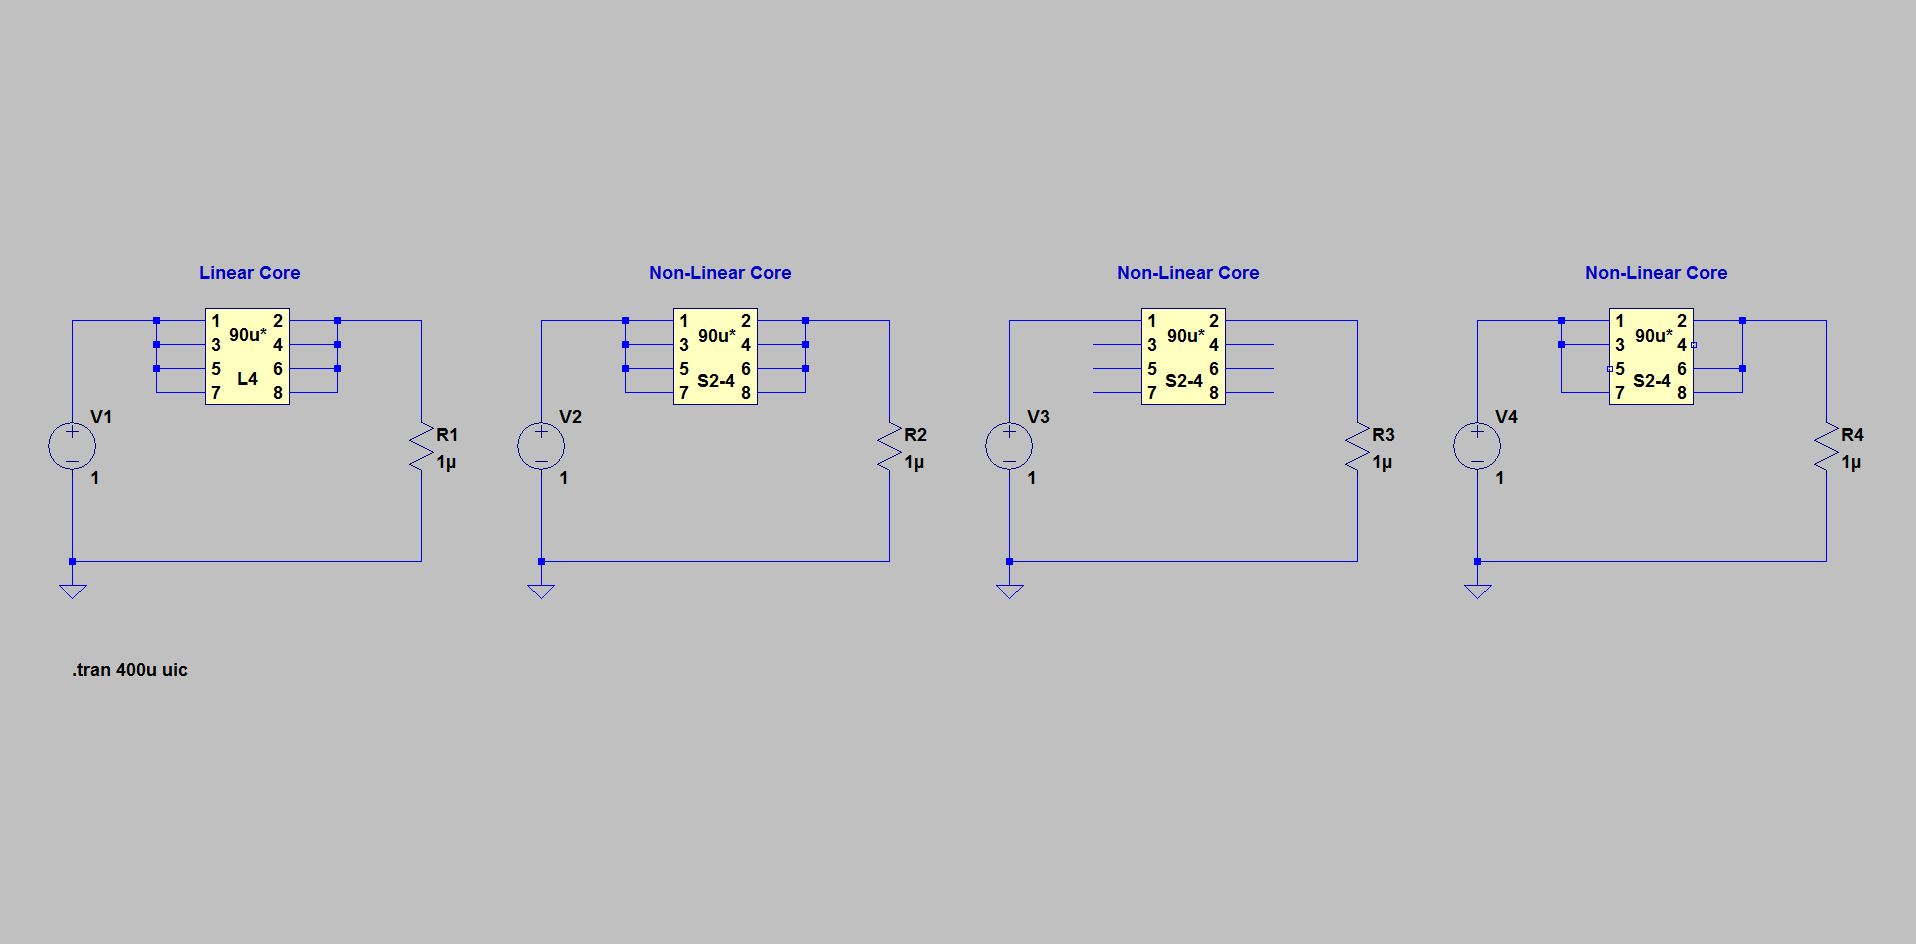
Simulation of Saturation with 4-Wire CM-Chokes
In this simulation, 4-Wire Common-Mode-Chokes (CM) are shown - with the left model having purely linear behavior, while the other models emulate the saturation behavior of a nanocrystalline material. Despite the different circuits, the same behavior always applies to the CM-Chokes here, regardless if all lines are connected in parallel - or only three, or only two or only one.
The linear and the non-linear choke also have the same frequency response, which was also modeled on a nanocrystalline material.

Conclusion
With the models shown here, Multi-Wire CM-Chokes (and Multi-Wired CM-Cores) can be fully mapped in all relevant properties - with the desired Frequency Characteristics as well as with the desired Saturation Behavior.
Thus, e.g. HV-Filters in 3-Phase On-Board Chargers can be designed and tested to the limits of their ampacity - and beyond.
The diagram shows the current change over time - blue the Linear CM-Core - turquoise the Non-Linear CM-Core
All non-linear simulations show the same curve and lie one above the other - with the turquoise curve on top
Defining the start of saturation at 10% deviation from the linear behavior, the saturation current here is
just over 2 A
© Ingenieurbüro Lindenberger 8447